Quantitative Evaluation of Mura in Display

Today’s consumers have access to a wide variety of flat-panel display technology, including the most common Liquid Crystal Display (LCD) and the emerging Organic Light-Emitting Diode (OLED). While LCD technology undisputedly dominates the TV scene, OLED starts to make its presence in devices with smaller screen like mobile phones, portable devices and monitors for computer. Manufacturers continue to innovate in order to provide additional value to consumers. Hence, the expectations for display devices’ performance, especially image quality are getting higher.
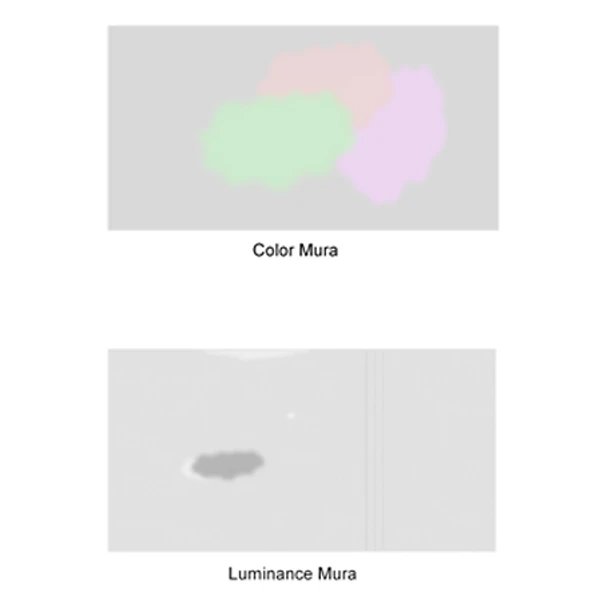
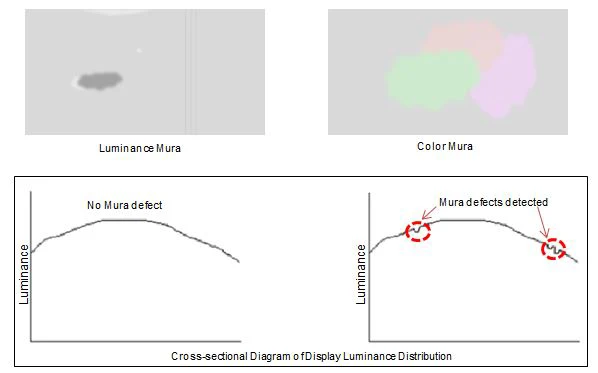
There are many image parameters such as brightness, contrast, color reproduction, viewing angle and response time, which evaluation can be quantified easily by means of photometric and colorimetric instruments. However, there are certain image quality inspections that are still dependent on visual evaluation and are conducted by experienced inspectors. Visual evaluation methodology has a number of flaws like the inconsistency in detection due to human subjectivity and the limitations of human sensitivity. One such image quality inspection which depends on visual evaluation is the ‘Display Mura’ (colloquially known as “clouding”) analysis.
Visual Evaluation of Mura Defect
Based on conventional visual inspection method, limit samples are commonly used to determine whether the mura levels are “acceptable” or “unacceptable”. However, visual inspection alone is difficult to inspect mura quality level reliably and consistently because mura can come in various shapes, sizes and contrast level. Besides the luminance and color contrast difference mentioned previously, there are several other factors that may affect the detection of mura defect by an inspector such as:
- Visual sensitivity of inspector
- Psychological factor
- Distance between display and inspector
- Display size
- Color and illuminance of ambient lighting
Quantification of Luminance and Color Mura Evaluation
Although numerous studies of quantitative evaluation techniques of luminance and color mura have been carried out, a widely recognized quantitative evaluation standard have yet to be established. Quantitative evaluation of mura defects is made possible with the help of an advanced imaging measurement system, capable of capturing both the luminance and color distributions of displays within seconds coupled with image processing algorithm designed to analyse complex image content.
In 2002, a standard on quantitative evaluation of mura was established by SEMI (Semiconductor Equipment and Materials International). This standard defines the measurement index for mura in FPD image quality inspection based on the result from investigating human eye’s sensitivity to mura in ergonomics approach by expressing the function of the major axis and contrast of mura. However, this standard uses only luminance distribution data measured by imaging photometer for the calculation of “SEMU” (unit of mura, an abbreviation of SEMI MURA). Chromaticity distribution data is not evaluated in this standard and hence, color mura quantification method has not been established by this standard yet.

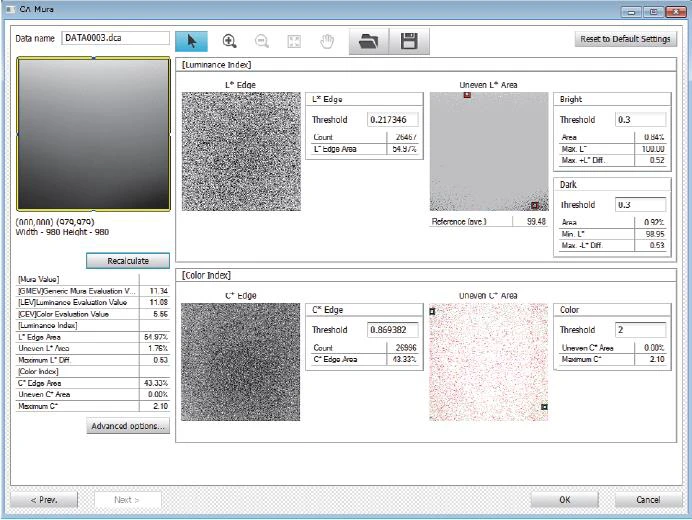
Konica Minolta introduces a versatile Mura Evaluation Software known as CA-Mura which simplifies the process of quantifying both luminance and color mura. This software was created using the mura quantitative evaluation algorithm developed by leading display manufacturer, Sony Corporation. Used exclusively with Konica Minolta 2D Color Analyzer CA-2500, this proprietary software is designed to provide mura values that closely correlate with visual evaluation.
A-Mura determines the luminance and chromaticity distribution of a display from the XYZ data measured by the 2D color analyzer and applies the spatial characteristics of human vision. These data are then converted to the CIE L* a* b* color space for the analysis of luminance mura and color mura expressed as:
- Luminance Evaluation Value (LEV) – For quantification of luminance mura
- Color Evaluation Value (CEV) – For quantification of color mura
- General Mura Evaluation Value (GMEV) – For combined quantification of both luminance and color mura

Besides the above mura values, mura images and other luminance and color indices are provided for a more comprehensive analysis. These indices consist of:
• Luminance Index
- – Luminance (L*) Edge Area
- – Uneven Luminance (L*) Area
- – Maximum Luminance (L*) Difference
• Color index
- – Color (C*) Edge Area
- – Uneven Color (C*) Area
- – Maximum Color (C*)
For more information on luminance and color mura evaluation, click here or contact us a (+65) 6563 5533 for a free consultation.
