Detecting Plant Disease and Stress Using Hyperspectral Imaging

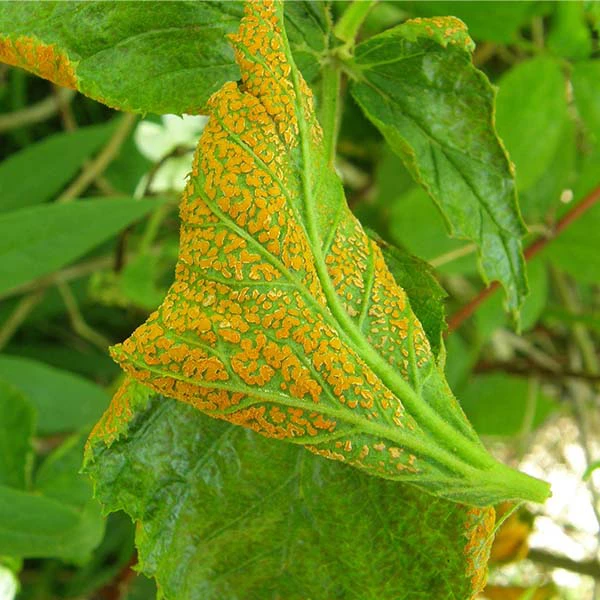
Detecting plant disease and stress is a vital activity of crop plants management. The ability to identify them at the early stage enables early response to change crop management practices or prevent the spread of infection. Conventional methods involve checking plants for visible symptoms, which tend to exhibit at the middle or late stages of infection, or chemical analysis. These methods can be time-consuming or involve tedious extraction steps and destructive measurements of plant tissue. Hence, many avenues of research are adopting hyperspectral imaging (HSI) due to their non-destructive approach to provide the physiological and structural information on plants, providing an opportunity to identify disease and stress before visible symptoms manifest.
HSI is a technique that captures spatial and spectral information of an object over a wide range of the electromagnetic spectrum. The collected data, called hypercube or data cube, contains 2D spatial images of hundreds of contiguous and narrow spectral (wavelength) bands. The data can then be processed using vegetation indices or techniques to detect and classify plant disease and stress. For example, Weng et al. (2018) combine HSI with the LSSVM (least squares support vector machine) to classify between the healthy citrus tree and those infected with the citrus greening disease. Bravo et al. (2003) use HSI with the combination of NDVI (normalized difference vegetation index) and QDA (quadratic discriminant analysis) to discriminate the spectra of wheat plants between the healthy and those with yellow rust.
When selecting the hyperspectral camera for your application, there are some factors one has to consider.
Spectral Range
Most hyperspectral cameras are designed to measure only a particular sub-range of the electromagnetic spectrum like the visible and near-infrared light (VNIR) around the 400 – 1000 nm wavelength range, short-wavelength infrared (SWIR) around the 1000 – 2500 nm wavelength range, etc. The selection of hyperspectral cameras should be based on their spectral range to cover the wavelength of your intended application. For example, a hyperspectral camera with VNIR spectral range would be suitable to measure the changes in the leaf pigmentation (around the 400–700 nm range). But to capture changes in the water content (around the 1300–2500 nm range), a hyperspectral camera with SWIR spectral range would be more suitable.
Technology
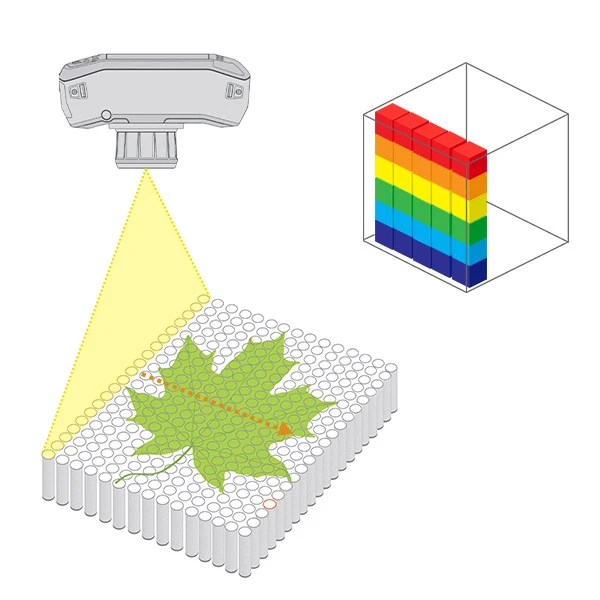
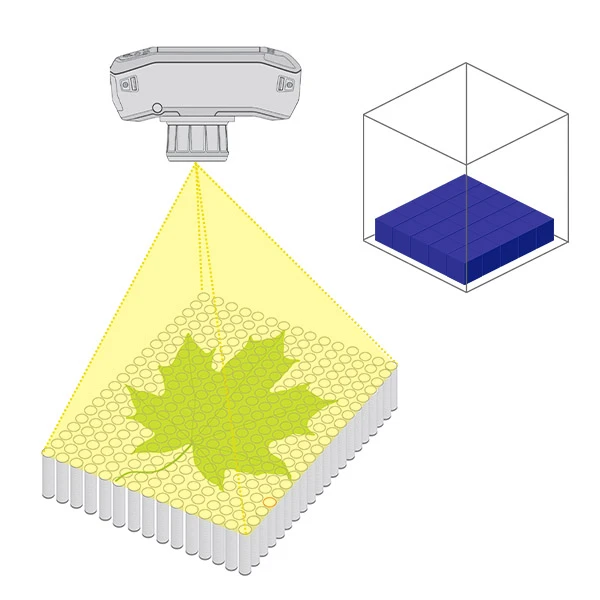
There are various types of hyperspectral cameras, and they can be categorized by their technology, such as push broom (line scan), tunable filter, etc. Their main differences are how they capture data and their illumination requirement. For example, push broom capture data by scanning a single line across the sample (Figure 1) and require only to illuminate this narrow line. Tunable filter capture data of one spectral band at a time (Figure 2) and require illumination over a much larger area. The larger the illumination area, the more challenging it is to achieve a uniform and stable illumination. Most light sources are point sources, and generating a uniform and stable illumination for area imaging would mean the light source has to be further away from the target sample.

Figure 1 – Illustration of Push broom (line scan)

Figure 2 – Illustration of tunable filter
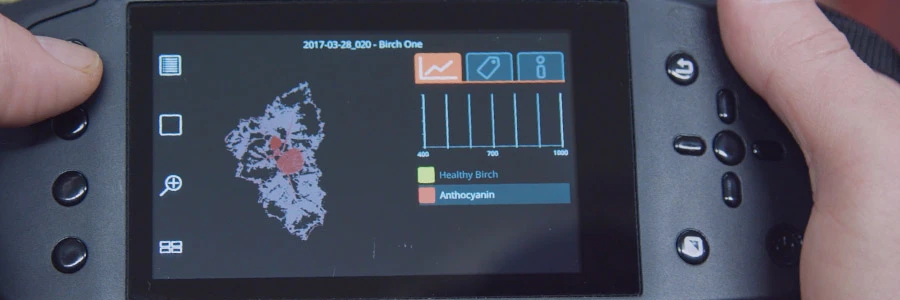
Specim, a global leader in HSI solutions, has a wide selection of push broom hyperspectral cameras, from portable Specim IQ to airborne HSI systems, covering wavelength ranging from visible to long wavelength infrared (LWIR). Watch this video to find out more about how Specim hyperspectral cameras work.

Need more information on HSI? Require assistance in setting up a HSI system for your application? Contact our specialist for a free consultation now.
